> For the complete documentation index, see [llms.txt](https://postica.gitbook.io/binding-system-3/llms.txt). Markdown versions of documentation pages are available by appending `.md` to page URLs; this page is available as [Markdown](https://postica.gitbook.io/binding-system-3/project-tools/performance.md).

# Performance

What makes it fast, and what to do when it is not fast enough.

Measure with the [Bindings Monitor](/binding-system-3/project-tools/diagnostics/bindings-monitor.md) first, then choose the optimization that addresses the cost you found.

## Read next

<table data-view="cards"><thead><tr><th></th><th></th><th data-hidden data-card-target data-type="content-ref"></th><th data-hidden data-card-cover data-type="files"></th></tr></thead><tbody><tr><td><strong>Phased Bindings</strong></td><td>Only re-run what changed</td><td><a href="/binding-system-3/project-tools/performance/phased-bindings.md">Phased Bindings</a></td><td><a href="https://3048705056-files.gitbook.io/~/files/v0/b/gitbook-x-prod.appspot.com/o/spaces%2FLUfBXR02sJ5i0MxwYbaV%2Fuploads%2Fgit-blob-2ca76a6c3a7b1f7e0361e0aba8b959e8bb44c9cd%2Fcover-pipeline.svg?alt=media">cover-pipeline.svg</a></td></tr><tr><td><strong>Optimized Accessors</strong></td><td>The path walk removed at build time</td><td><a href="/binding-system-3/project-tools/performance/optimized-accessors.md">Build-Time Optimized Accessors</a></td><td><a href="https://3048705056-files.gitbook.io/~/files/v0/b/gitbook-x-prod.appspot.com/o/spaces%2FLUfBXR02sJ5i0MxwYbaV%2Fuploads%2FxIvAK3HimoIkq7qStu3d%2FScreenshot%202026-09-29%20at%2013.58.41.png?alt=media&amp;token=8ded204f-9edb-45ce-ac8d-989251ea4bc9">Screenshot 2026-09-29 at 13.58.41.png</a></td></tr><tr><td><strong>IL2CPP Specializations</strong></td><td>Compile the generic pipeline for the types your project uses.</td><td><a href="/binding-system-3/project-tools/performance/il2cpp-specializations.md">IL2CPP Specializations</a></td><td><a href="https://3048705056-files.gitbook.io/~/files/v0/b/gitbook-x-prod.appspot.com/o/spaces%2FLUfBXR02sJ5i0MxwYbaV%2Fuploads%2Fgit-blob-9e654bbbbfb909a765f9214ac562f442692cb2e6%2Fcover-reference.svg?alt=media">cover-reference.svg</a></td></tr><tr><td><strong>Performance Mode</strong></td><td>A leaner Inspector</td><td><a href="/binding-system-3/project-tools/performance/performance-mode.md">Performance Mode</a></td><td><a href="https://3048705056-files.gitbook.io/~/files/v0/b/gitbook-x-prod.appspot.com/o/spaces%2FLUfBXR02sJ5i0MxwYbaV%2Fuploads%2FgD3mOjptFh7QVGOsBdmG%2FScreenshot%202026-09-28%20at%2018.19.11.png?alt=media&amp;token=447017a8-7ed6-4df3-ae3c-0c7b00a8a0ae">Screenshot 2026-09-28 at 18.19.11.png</a></td></tr><tr><td><strong>Benchmarks</strong></td><td>Numbers, and how to get your own</td><td><a href="/binding-system-3/project-tools/performance/benchmarks.md">Benchmarks</a></td><td><a href="https://3048705056-files.gitbook.io/~/files/v0/b/gitbook-x-prod.appspot.com/o/spaces%2FLUfBXR02sJ5i0MxwYbaV%2Fuploads%2Fgit-blob-94539a21c3d39b80698328270319f367c907466f%2Fcover-diagnostics.svg?alt=media">cover-diagnostics.svg</a></td></tr></tbody></table>

## Reflection is used to find the member, never to read it

This is the single most important thing to understand about the runtime, and the thing most people assume wrongly.

Reflection runs **once**, when a binding is first used, to resolve the path into members. From that point on there is no reflection anywhere in the hot path:

<table><thead><tr><th width="270">Path segment</th><th>What it costs</th></tr></thead><tbody><tr><td><strong>A field</strong></td><td><strong>Direct access.</strong> The field's location within the object is resolved once into a byte offset, and reads and writes go straight to it. No <code>FieldInfo.GetValue</code>, no boxing, no dispatch. A run of consecutive value-type fields collapses into a <strong>single</strong> offset, so <code>a.b.c</code> is one addition and one read rather than three hops. This is close enough to native field access that the difference is hard to measure.</td></tr><tr><td><strong>A property</strong></td><td>A strongly typed delegate bound to the getter or setter, created with <code>MethodInfo.CreateDelegate</code>. One virtual call, the same as calling the property through an interface.</td></tr><tr><td><strong>A method or indexer</strong></td><td>The same: a typed delegate over the real method, with the arguments passed as typed parameters rather than an <code>object[]</code>.</td></tr></tbody></table>

`MethodInfo.Invoke` and `FieldInfo.GetValue`, the slow parts of reflection everyone has measured, are never called while your game is running.

{% hint style="success" %}
So the cost model is not "reflection per read". It is **one delegate call per segment that is not a field**, plus one call per non-empty pipeline stage. A binding to a plain field with no converter and no modifiers is about as cheap as a connection can be: [measured](/binding-system-3/project-tools/performance/benchmarks.md#one-member) at about 8 ns per read on IL2CPP and 10 ns on Mono, allocating nothing. What costs real time is a path with several hops through properties that return structs, and [generated accessors](/binding-system-3/project-tools/performance/optimized-accessors.md) collapse exactly that case into a single direct call.
{% endhint %}

## Everything else that makes it fast

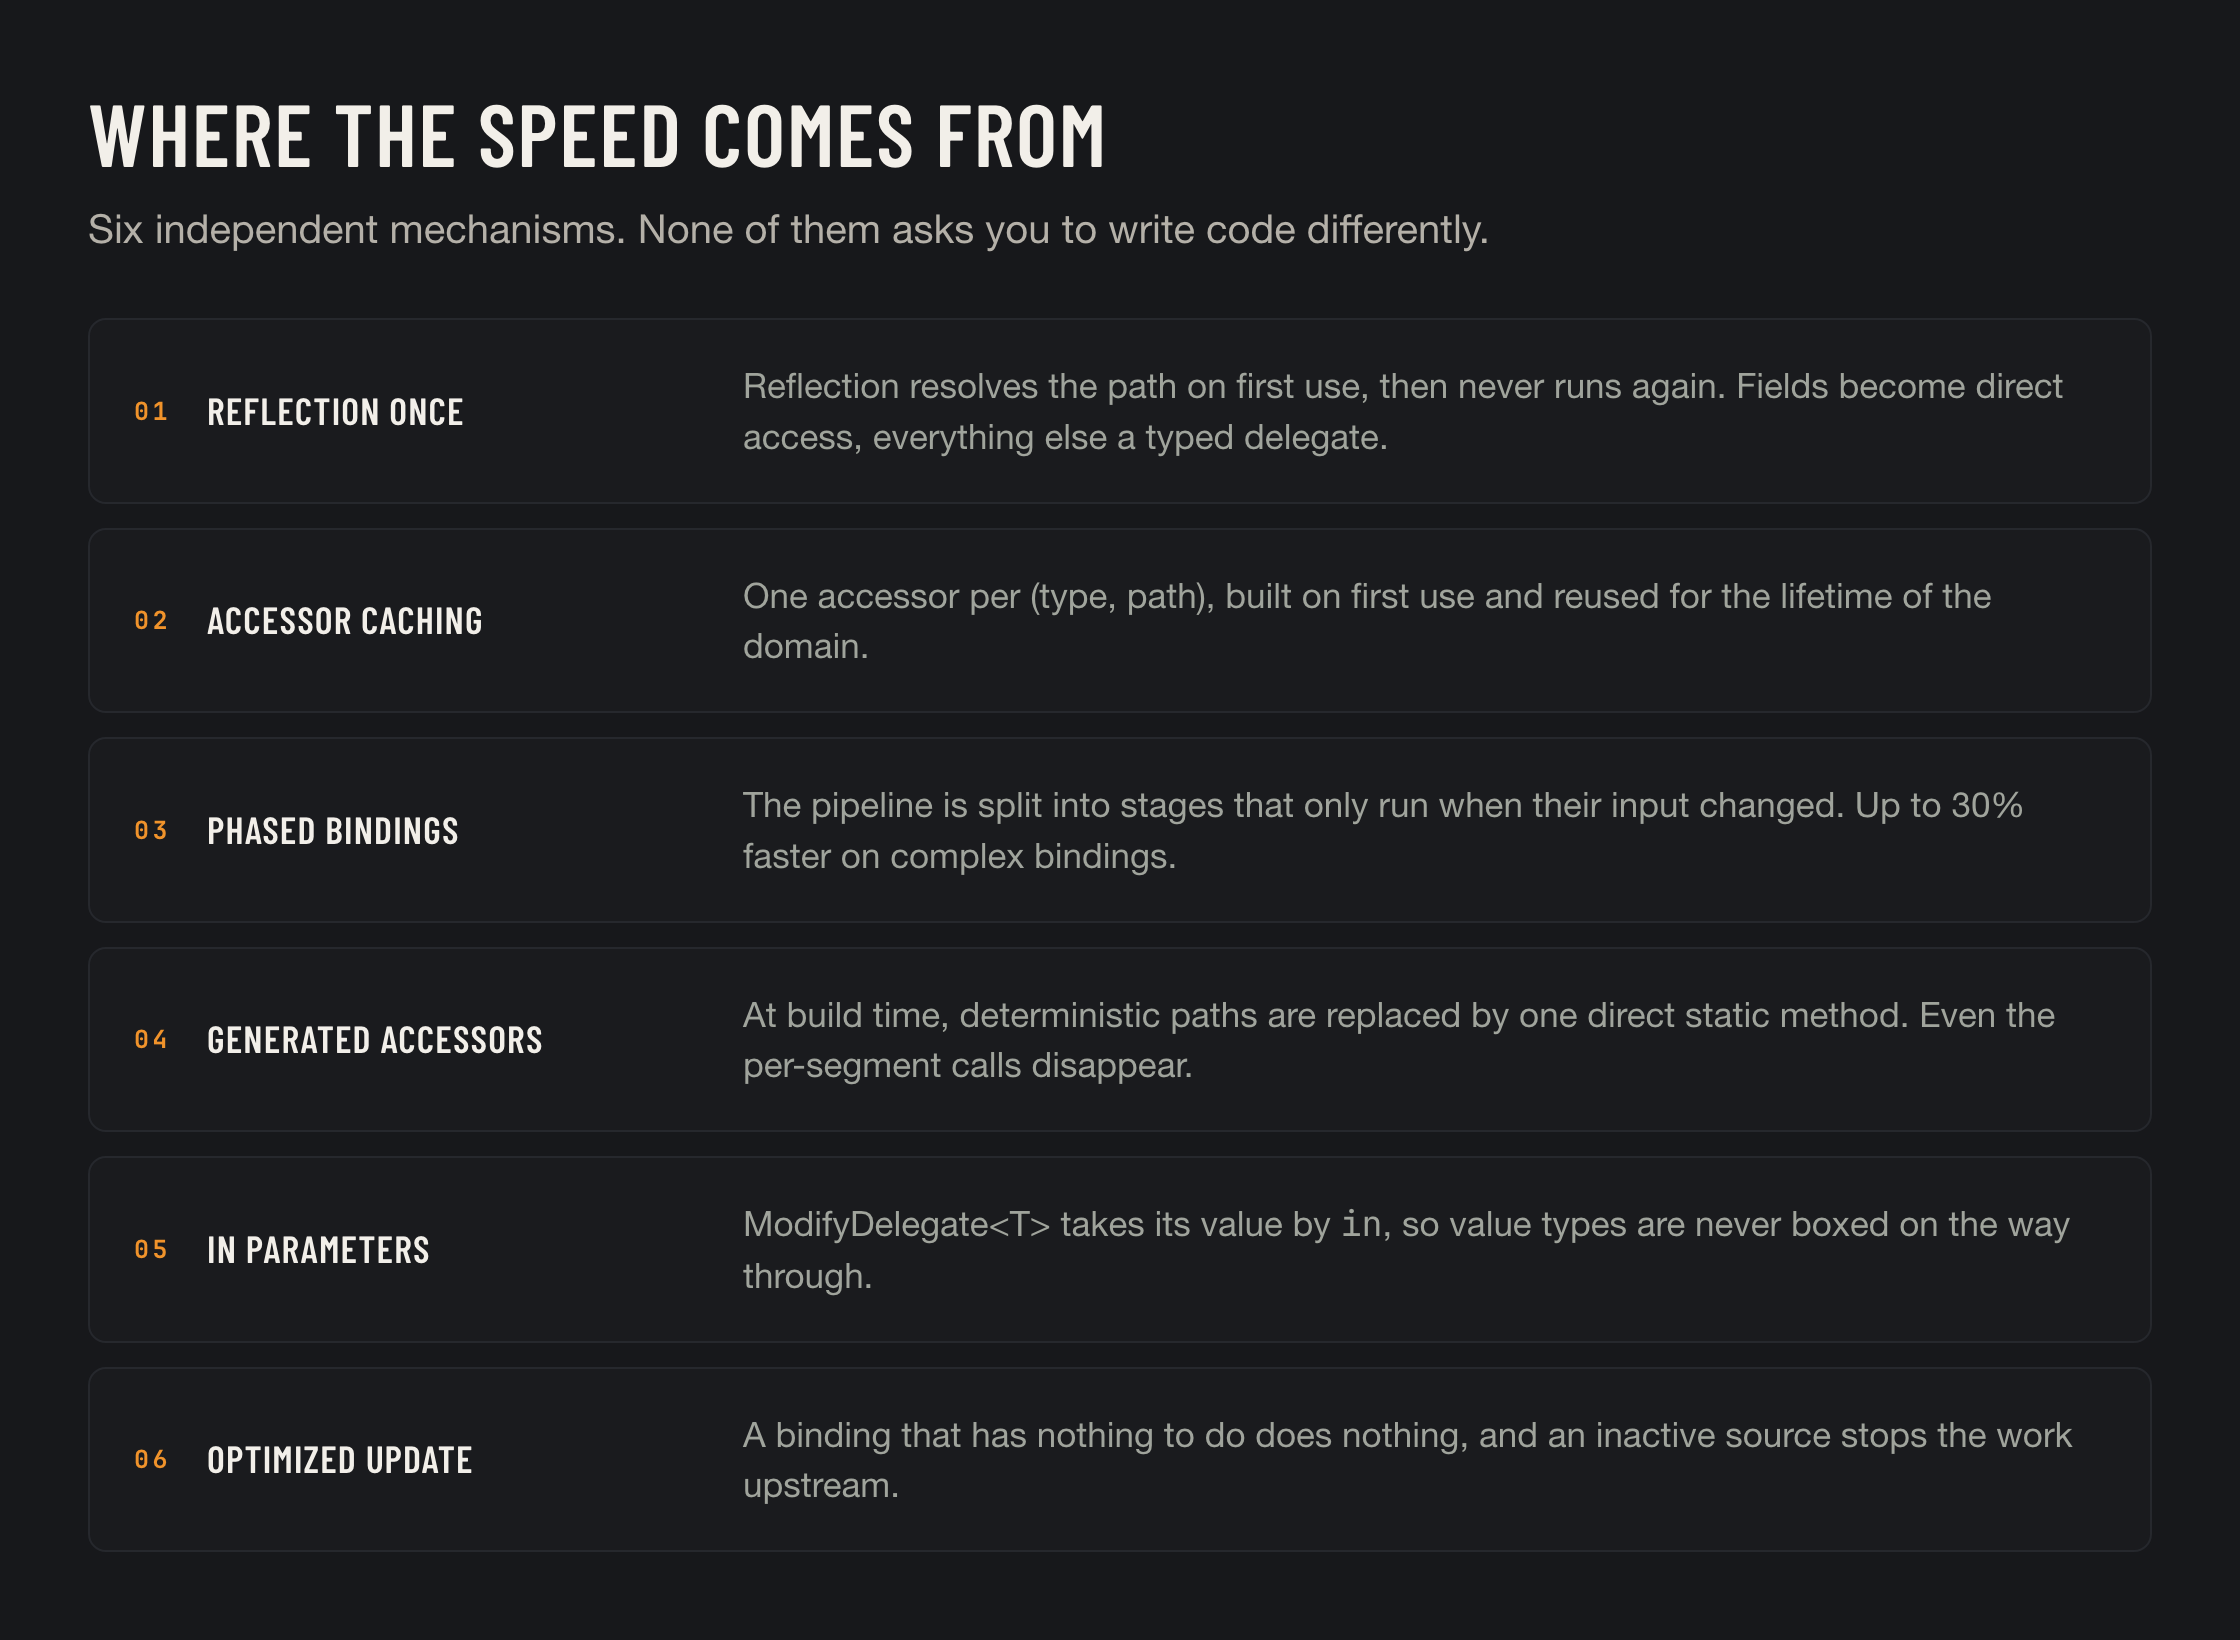
<figure><img src="https://3048705056-files.gitbook.io/~/files/v0/b/gitbook-x-prod.appspot.com/o/spaces%2FLUfBXR02sJ5i0MxwYbaV%2Fuploads%2Fgit-blob-ed1ad84c816d15ac5ffcf000ac14798e71311df1%2Fperformance-stack.png?alt=media" alt="Where the speed comes from"><figcaption></figcaption></figure>

<table><thead><tr><th width="270">Mechanism</th><th>What it does</th></tr></thead><tbody><tr><td><strong>Accessor caching</strong></td><td>That one-off resolution is cached per <code>(type, path)</code> and shared by every binding using the same pair, so the second binding to <code>position.x</code> does no work at all to be built.</td></tr><tr><td><a href="/binding-system-3/project-tools/performance/phased-bindings.md"><strong>Phased bindings</strong></a></td><td>The pipeline is split into stages that only re-run when their input changed. On an unchanged source the cached stages are skipped entirely, so the longer the chain the larger the share saved. On by default.</td></tr><tr><td><a href="/binding-system-3/project-tools/performance/optimized-accessors.md"><strong>Generated accessors</strong></a></td><td>At build time, deterministic paths are replaced by a single generated static method, so even the per-segment delegate calls disappear and the path is not resolved at runtime at all. Off by default.</td></tr><tr><td><a href="/binding-system-3/project-tools/performance/il2cpp-specializations.md"><strong>IL2CPP specializations</strong></a></td><td>The pipeline instantiates its generic types at runtime, over the types it finds in a scene, which IL2CPP compiles as shared code with a runtime adapter on every value-type call. This names those instantiations at build time so IL2CPP compiles them specialised. Measured at 1.6x to 3.3x on multi-hop paths, and on <code>Transform.localScale.x</code> it closes the gap against Mono entirely; single-member paths do not change. Off by default: more code and memory is the price.</td></tr><tr><td><strong>No boxing</strong></td><td>Modifiers use <code>ModifyDelegate&#x3C;T></code>, which takes its value by <code>in</code>. A <code>float</code> going through five modifiers allocates nothing.</td></tr><tr><td><a href="/binding-system-3/overview/modes-and-updates.md#optimized-update"><strong>Optimized update</strong></a></td><td>A binding with nothing to do does nothing, and an inactive source stops the work upstream.</td></tr></tbody></table>

On top of those, the small things: aggressive inlining on the hot paths, IL-level method hooking in the Windows editor, a thread-safe wrapper only where a binding is actually read off the main thread, and per-frame caching of source resolution.

## Where the time actually goes

Before optimizing, know which of these you are paying for. They are very different costs.

<table><thead><tr><th width="290">Cost</th><th>When it is paid</th></tr></thead><tbody><tr><td><strong>Building the accessor</strong></td><td>Once, on first use, and cached for every binding after it. This is the only place reflection appears. Amortised to nothing.</td></tr><tr><td><strong>Resolving the source</strong></td><td>Free for a direct reference. See <a href="/binding-system-3/overview/sources.md#cost">the source mode table</a> for the rest. A source that cannot be found is the expensive case.</td></tr><tr><td><strong>Walking the path</strong></td><td>One delegate call per segment, and direct access for field segments. One call in total with <a href="/binding-system-3/project-tools/performance/optimized-accessors.md">generated accessors</a>.</td></tr><tr><td><strong>The pipeline</strong></td><td>One call per non-empty stage. Empty stages are never built.</td></tr><tr><td><strong>Scheduling</strong></td><td>Only for <a href="/binding-system-3/overview/proxy-bindings.md">proxy bindings</a> with an <a href="/binding-system-3/overview/modes-and-updates.md">update point</a>, and bind fields with Auto Update. A lazily read <code>Bind&#x3C;T></code> costs nothing when nobody reads it. See <a href="/binding-system-3/overview/two-ways-to-bind.md">Two Ways to Bind</a>.</td></tr></tbody></table>

{% hint style="success" %}
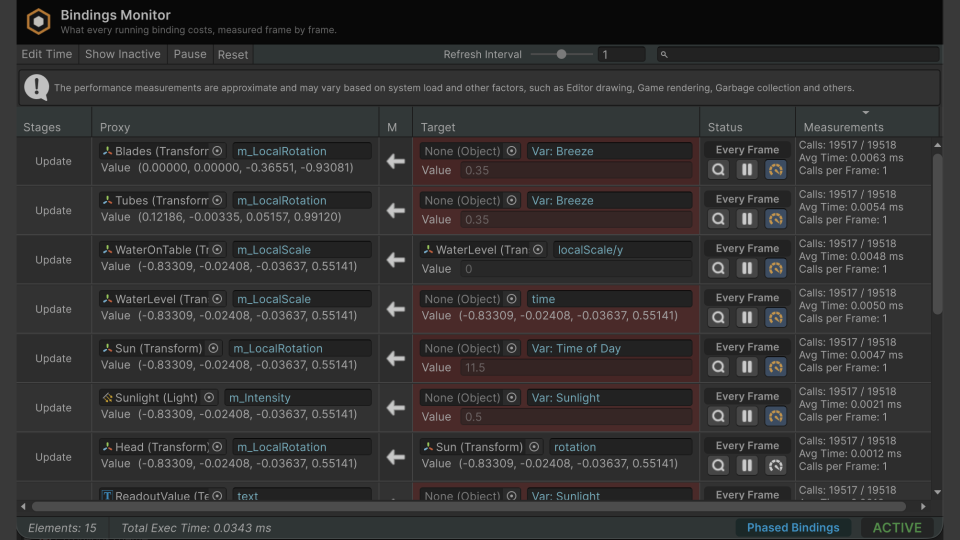
The [Bindings Monitor](/binding-system-3/project-tools/diagnostics/bindings-monitor.md) measures all of this per binding, live. Use it before changing anything: the expensive binding is rarely the one you would have guessed.
{% endhint %}

## A tuning order that works

1. **Measure.** [Bindings Monitor](/binding-system-3/project-tools/diagnostics/bindings-monitor.md), sorted by execution time.
2. **Reduce the rate.** An [interval](/binding-system-3/overview/modes-and-updates.md#intervals) on the worst offenders. A UI value at 10Hz looks the same as at 60Hz.
3. **Skip the no-ops.** [Optimized Update](/binding-system-3/overview/modes-and-updates.md#optimized-update) on anything whose value is usually stable.
4. **Fix the sources.** A pattern or scene search that fails costs more than one that resolves. Check the [status lights](/binding-system-3/overview/sources.md#the-status-light).
5. **Turn on the build optimizer.** [Generated accessors](/binding-system-3/project-tools/performance/optimized-accessors.md) for projects with many deep paths in built scenes.
6. **Then look at the editor.** If the *editor* is slow rather than the game, that is [Performance Mode](/binding-system-3/project-tools/performance/performance-mode.md), a different problem with a different fix.

## Editor speed is a separate question

Two things get confused often enough to be worth separating:

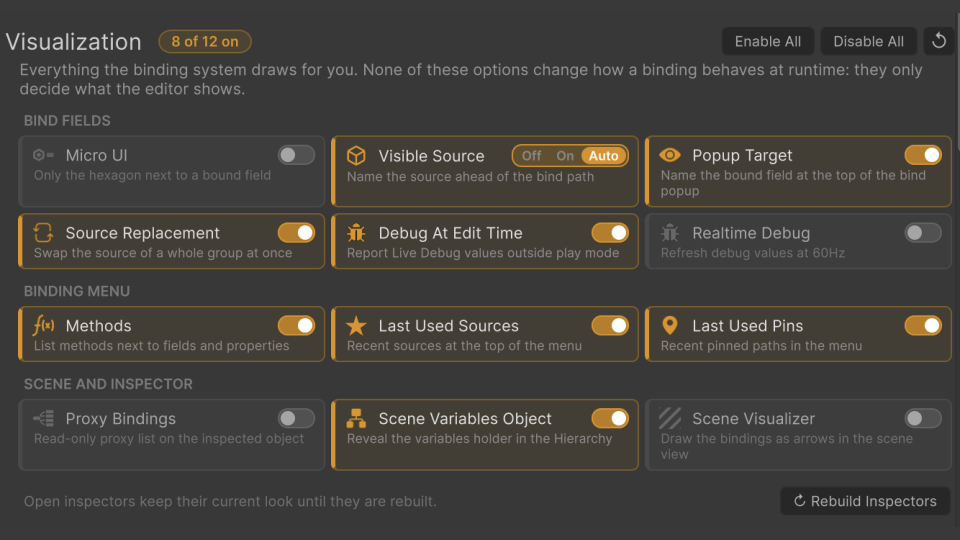
<table><thead><tr><th width="290">Symptom</th><th>Where to look</th></tr></thead><tbody><tr><td>The game runs slowly</td><td>This page, and the <a href="/binding-system-3/project-tools/diagnostics/bindings-monitor.md">monitor</a>.</td></tr><tr><td>Inspectors are slow to draw or open</td><td><a href="/binding-system-3/project-tools/performance/performance-mode.md">Performance Mode</a> and the <a href="/binding-system-3/reference/settings.md#visualization">Visualization panel</a>. Nothing here affects the build.</td></tr><tr><td>The bind path menu is slow to open</td><td>Lower <a href="/binding-system-3/overview/paths.md#depth-limits">Max Bind Path Depth</a>, or turn off <a href="/binding-system-3/reference/settings.md#visualization">methods in the bind path menu</a>.</td></tr></tbody></table>
